Device View
The new Device View was designed to make it quicker to move between the channels and days of data your device provides and make the information provided easier to read.
The at-a-glance Now View provides information about the current status of your device.
Device View Features
The new Device View has the following features:
- Channel Selection - Quickly see and select available device channels by either their name or optional alias.
- Now View - See the data type, current reading, alarm state, WiFi strength, battery level and more at a glance.
- Time Selection - See the data type, current reading, alarm state, WiFi strength, battery level and more at a glance.
Selecting a Channel
The Tab Bar at the top of the view allows you to select the Channel of data to view. Depending on the Device Model, there will be one to three channels of data.
Each Channel will contain a Now, 1 Day, 30 Days and 1 Year view of the data from the channel.
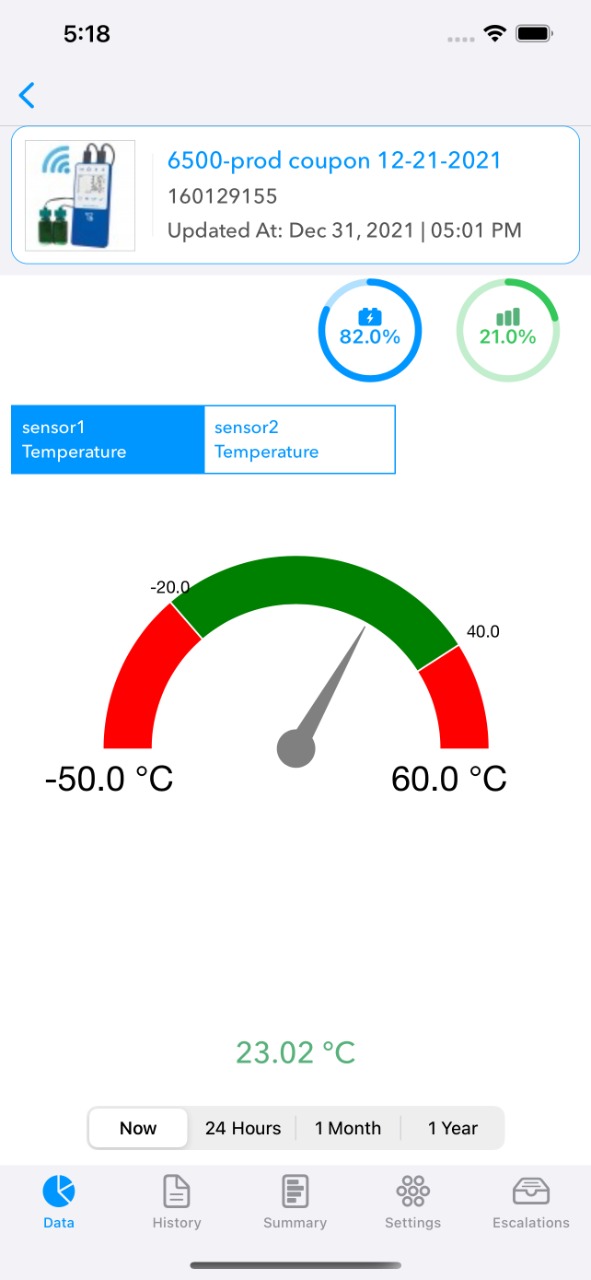
Now View
The new Now View provides at-a-glance information about the current status of your device such as current Alarm State, WiFi Signal Strength and Battery Level.
The Current Reading Gauge displays not only the current reading and unit of measure, but the Minimum and Maximum operating ranges for the given device channel and any Low or High Alarms that you have set.
Additionally, you can see the current Alarm Status of the device. If the device is in alarm, an alarm message will be displayed along and the status text and gauge indicator will turn red.
1 Day View
The new 1 Day View provide a graph of 24 hours of data for the given Channel:

Additional features of the graph includes:
- Double-Tap Zoom - Double-tap the main graph to zoom in and out.
- View Precise Readings - Tap and hold a point on the graph to see its exact reading.
30 Day View
The new 30 Day View provide a graph of 30 days of data for the given Channel:
The bottom of the graph is a Thumbnail view that allows you to zoom in on the data and see a detailed section of the data. Either drag the left or right Thumbs to specify the section of the data to see. You can also Header or Footer to snap to a specific region:
Additional features of the graph includes:
- Double-Tap Zoom - Double-tap the main graph to zoom in and out.
- View Precise Readings - Tap and hold a point on the graph to see its exact reading.
1 Year View
The new 1 Year View provide a graph of 365 days of data for the given Channel:
Additional features of the graph includes:
- Double-Tap Zoom - Double-tap the main graph to zoom in and out.
- View Precise Readings - Tap and hold a point on the graph to see its exact reading.