- Print
- DarkLight
- PDF
Article summary
Did you find this summary helpful?
Thank you for your feedback!
Probe Readings
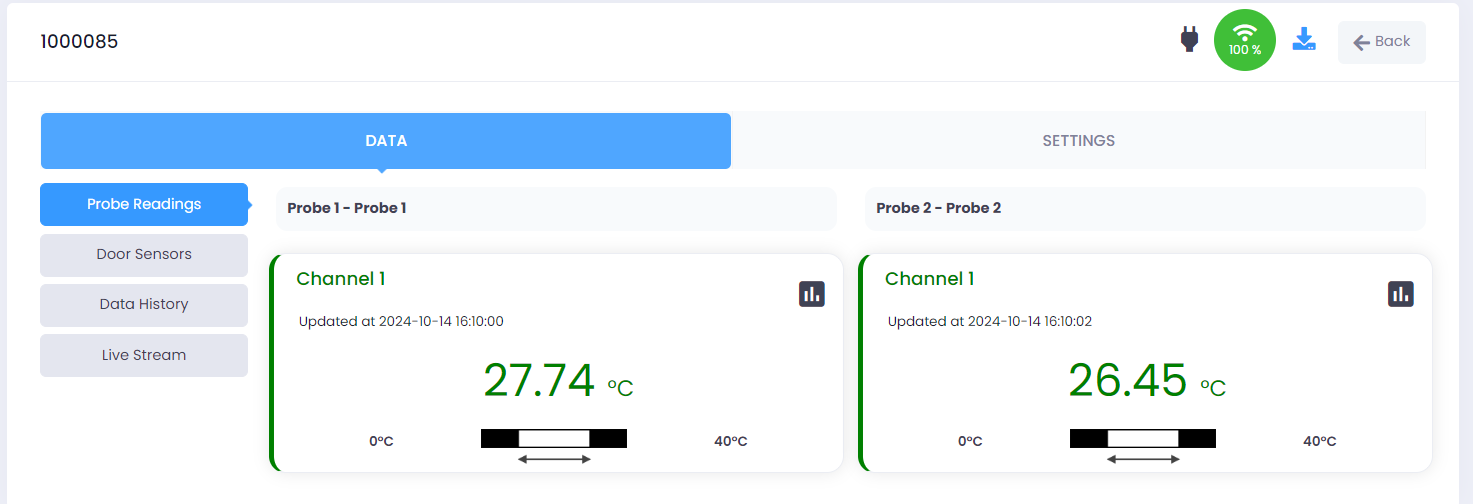
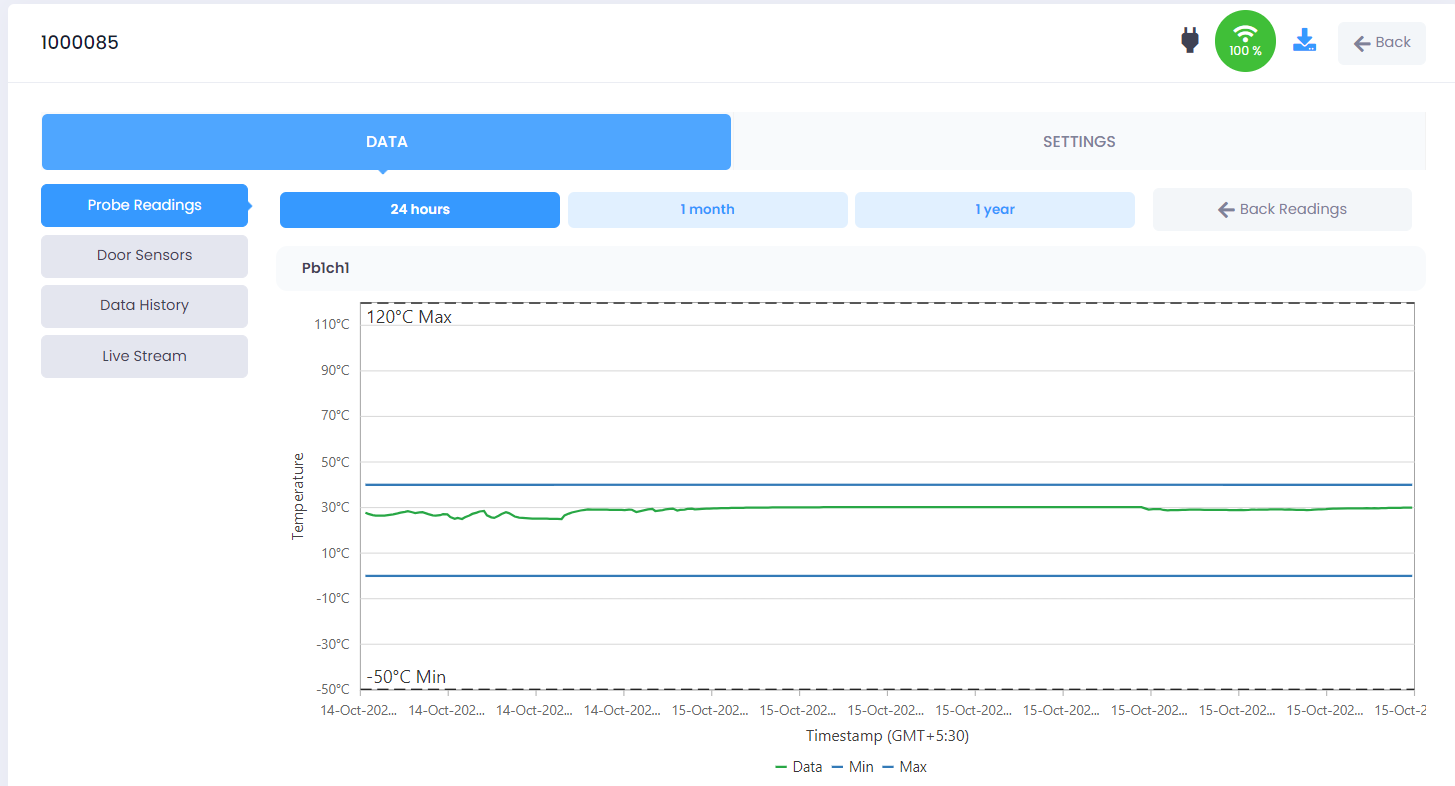
The Probe Readings tab allows users to view the current temperature readings for each probe connected to the device. It also offers graphical representations of the temperature data over different time periods (24 hours, 1 month, 1 year).


Field Insights
Accessing Probe Readings:
- Login into the TraceableLIVE® account.
- Select a device from the device list.
- From the Data menu, navigate to Probe Readings.
View Current Probe Readings:
- Each probe connected to the device will display its current temperature reading.
- This allows users to quickly monitor the real-time temperature for each channel/probe.
View Historical Temperature Data:
- To view historical temperature data in graphical format, click on graph icon displayed on the channel card.
- After clicking the graph icon, choose the desired time interval: 24 hours, 1 month, or 1 year, and the system will display a graph plotting the temperature changes over the selected period.
- This feature allows users to track temperature trends, identify potential fluctuations, and analyze the equipment's performance over time.
Was this article helpful?


