This feature is only available TraceableGO has been activated for your TraceableLIVE® account. See Managing Subscriptions for more details.
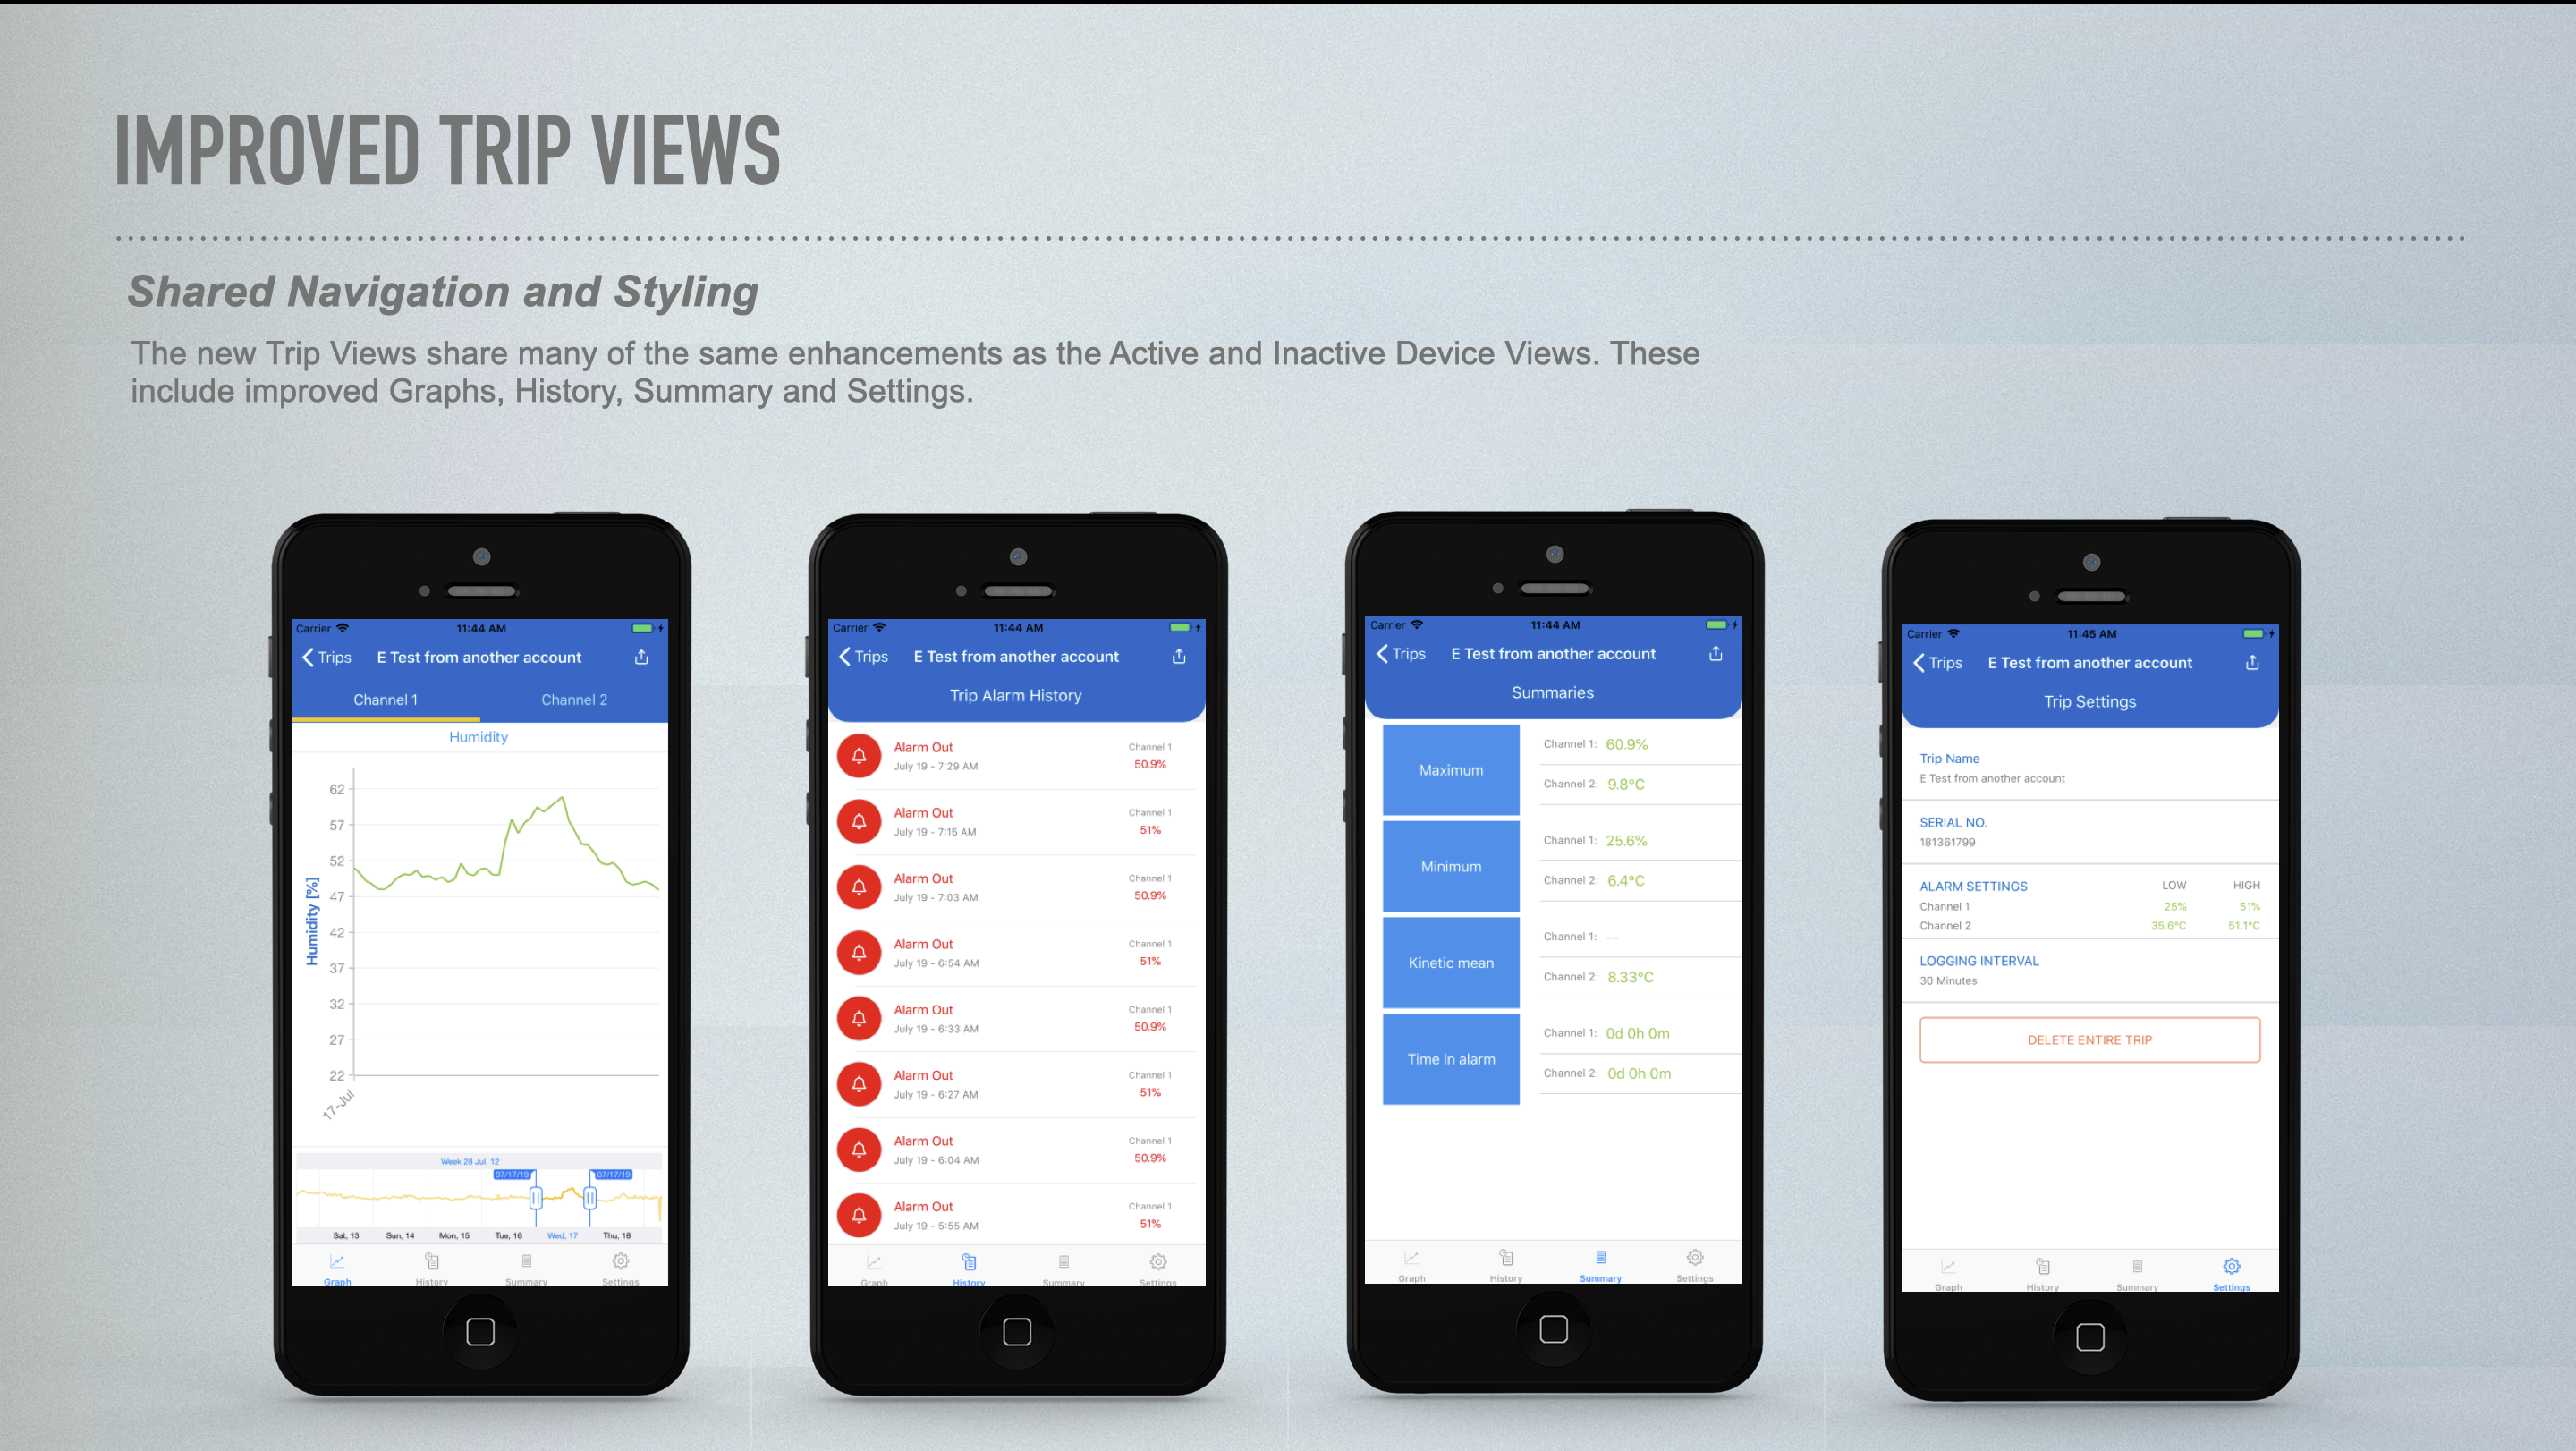
Viewing Datalogger Trips
The new Trip Views share many of the same enhancements as the Active and Inactive Device Views. These include improved Graphs, History, Summary and Settings views.
View Available Trips
From the Hamburger Menu select Datalogger Trips and the list of available Trips will be displayed.
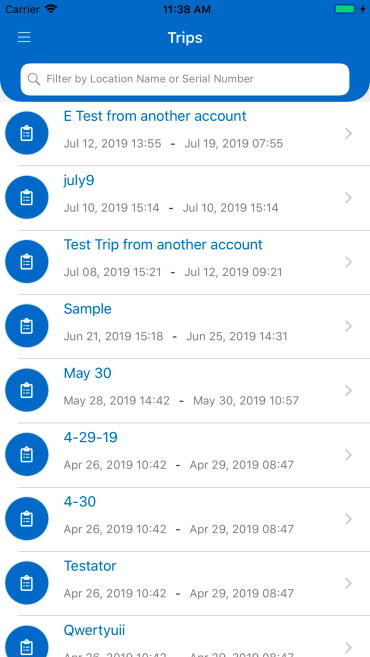
Selecting a Trip
Tap on a Trip to view and its Details page will be displayed:
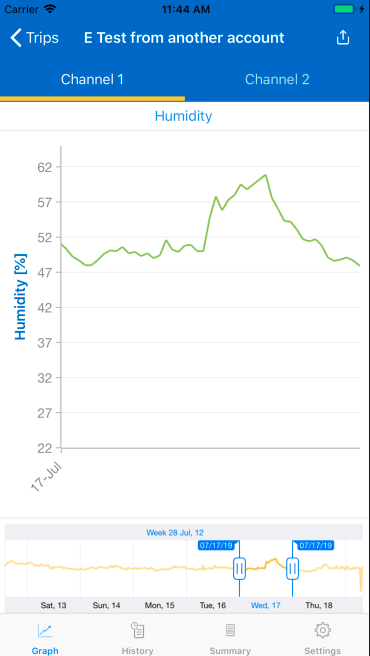
From here you can:
- Select a Channel - Tap the name of the channel to view at the top of the graph.
- Adjust the Range - Use the Graph Thumbnail at the bottom of the Graph to adjust the range of data that is shown. Drag the left and right Thumbs to limit the data shown. Click on a Week, Month or Quarter name to quickly snap the thumbs to that range.
- Double-Tap Zoom - Double-tap the main graph to zoom in and out.
- View Precise Readings - Tap and hold a point on the graph to see its exact reading.
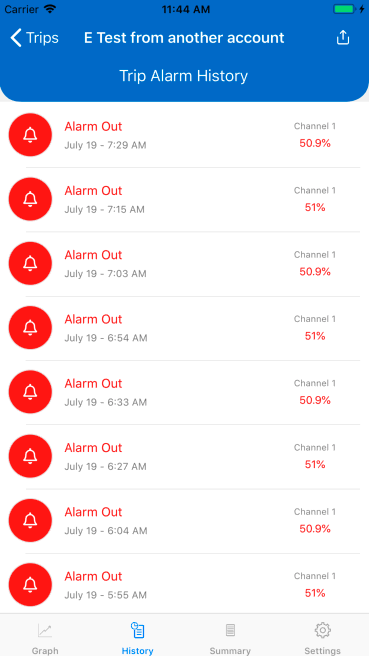
Alarm History
Tap the History tab at the bottom of the screen to see any alarms that occurred during the trip:
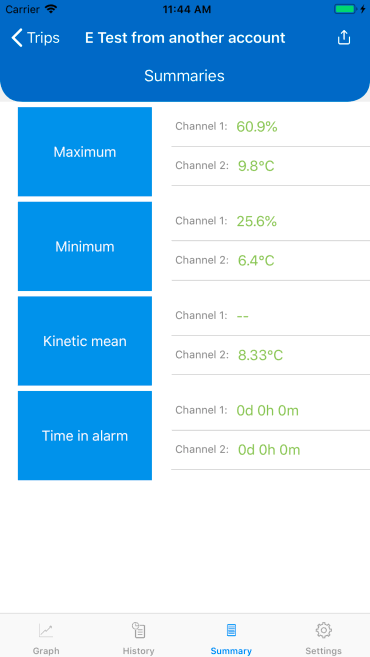
Trip Summary
Tap the Summary tab at the bottom of the screen to see a computed summary of the trip data:
Trip Settings
Tap the Setting tab at the bottom of the screen to see the Datalogger's setting that were in place during the time of the Trip:
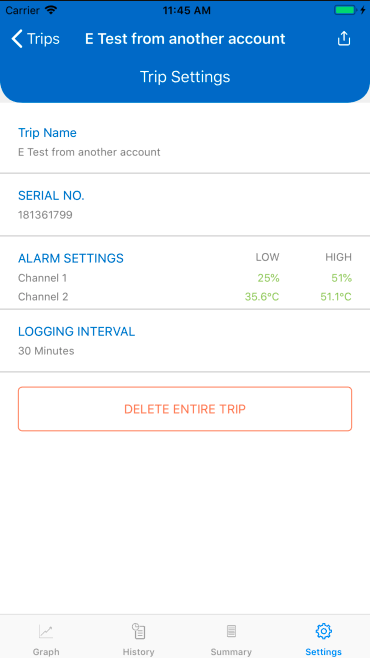
You can also delete the Trip from Device Cloud by tapping the Delete Entire Trip button at the bottom of the Settings View.